Loops
In Kumu, the three basic items you can create are elements, connections, and loops.
Visually speaking, elements are circles, connections are lines between the elements, and loops are groups of two or more connections.

Loops show up on the map as a text label, and the default position of that label is in the middle of all the connections that are part of the group.
You can use these visual tools in all kinds of different ways, but here are some common uses that we see:
Factors in a system (causes and effects)
Cause-and-effect relationships
Causal loops
Stocks
Flows
Sub-systems
Decisions, chances, and ends in a decision tree
Paths along the decision tree
Multi-part decisions
Steps in a process
Paths from one step to the next
Sub-processes
People
Interpersonal relationships
Sub-networks or communities
People & organizations
Connect people to the organizations they're affiliated with
Sub-networks or communities
Authors & books/articles they've co-authored
Connect authors to their books/articles
Sub-networks or communities
Stakeholders & areas of interest
Connect stakeholders to the areas they're interested in
Sub-networks or communities
Funders, non-profits, and population groups
Connect funders to non-proftis, and connect non-profits to the populations they serve
Sub-networks or communities
Companies and sectors/industries
Connect companies to their sectors/industries
Sub-networks or communities
Creating a loop
To create a loop, you can click the green button at the bottom of your map and select "Add loop". Then, click on the connections you want to include in the loop, then add a descriptive loop label below and press enter on your keyboard.
If you want to edit a loop, click on the loop's label to open its profile in the left side panel. In the bottom right corner of the profile, click the pencil icon to select and de-select connections that are a part of the loop.
Click & drag the loop label to move it, or hold down Option on your keyboard (Alt on Windows) and click & drag to move the entire loop, including all its elements and connections, while maintaining their structure.
Identifying loops in systems
Colloquially, you can use the word “loop” to describe any kind of line that curves around in a circle or an oval. When you’re mapping systems in Kumu, you’ll find many groups of connections that meet that definition, but they aren’t necessarily the loops that a system mapper is looking for.
In a system map, a great litmus test for discovering loops is to ask the question, “If I follow the arrows in this group of connections, can I get trapped?” If the answer is yes, you’ve found a loop!
If not, the structure is not a loop, but might still be complex enough to deserve some further study.
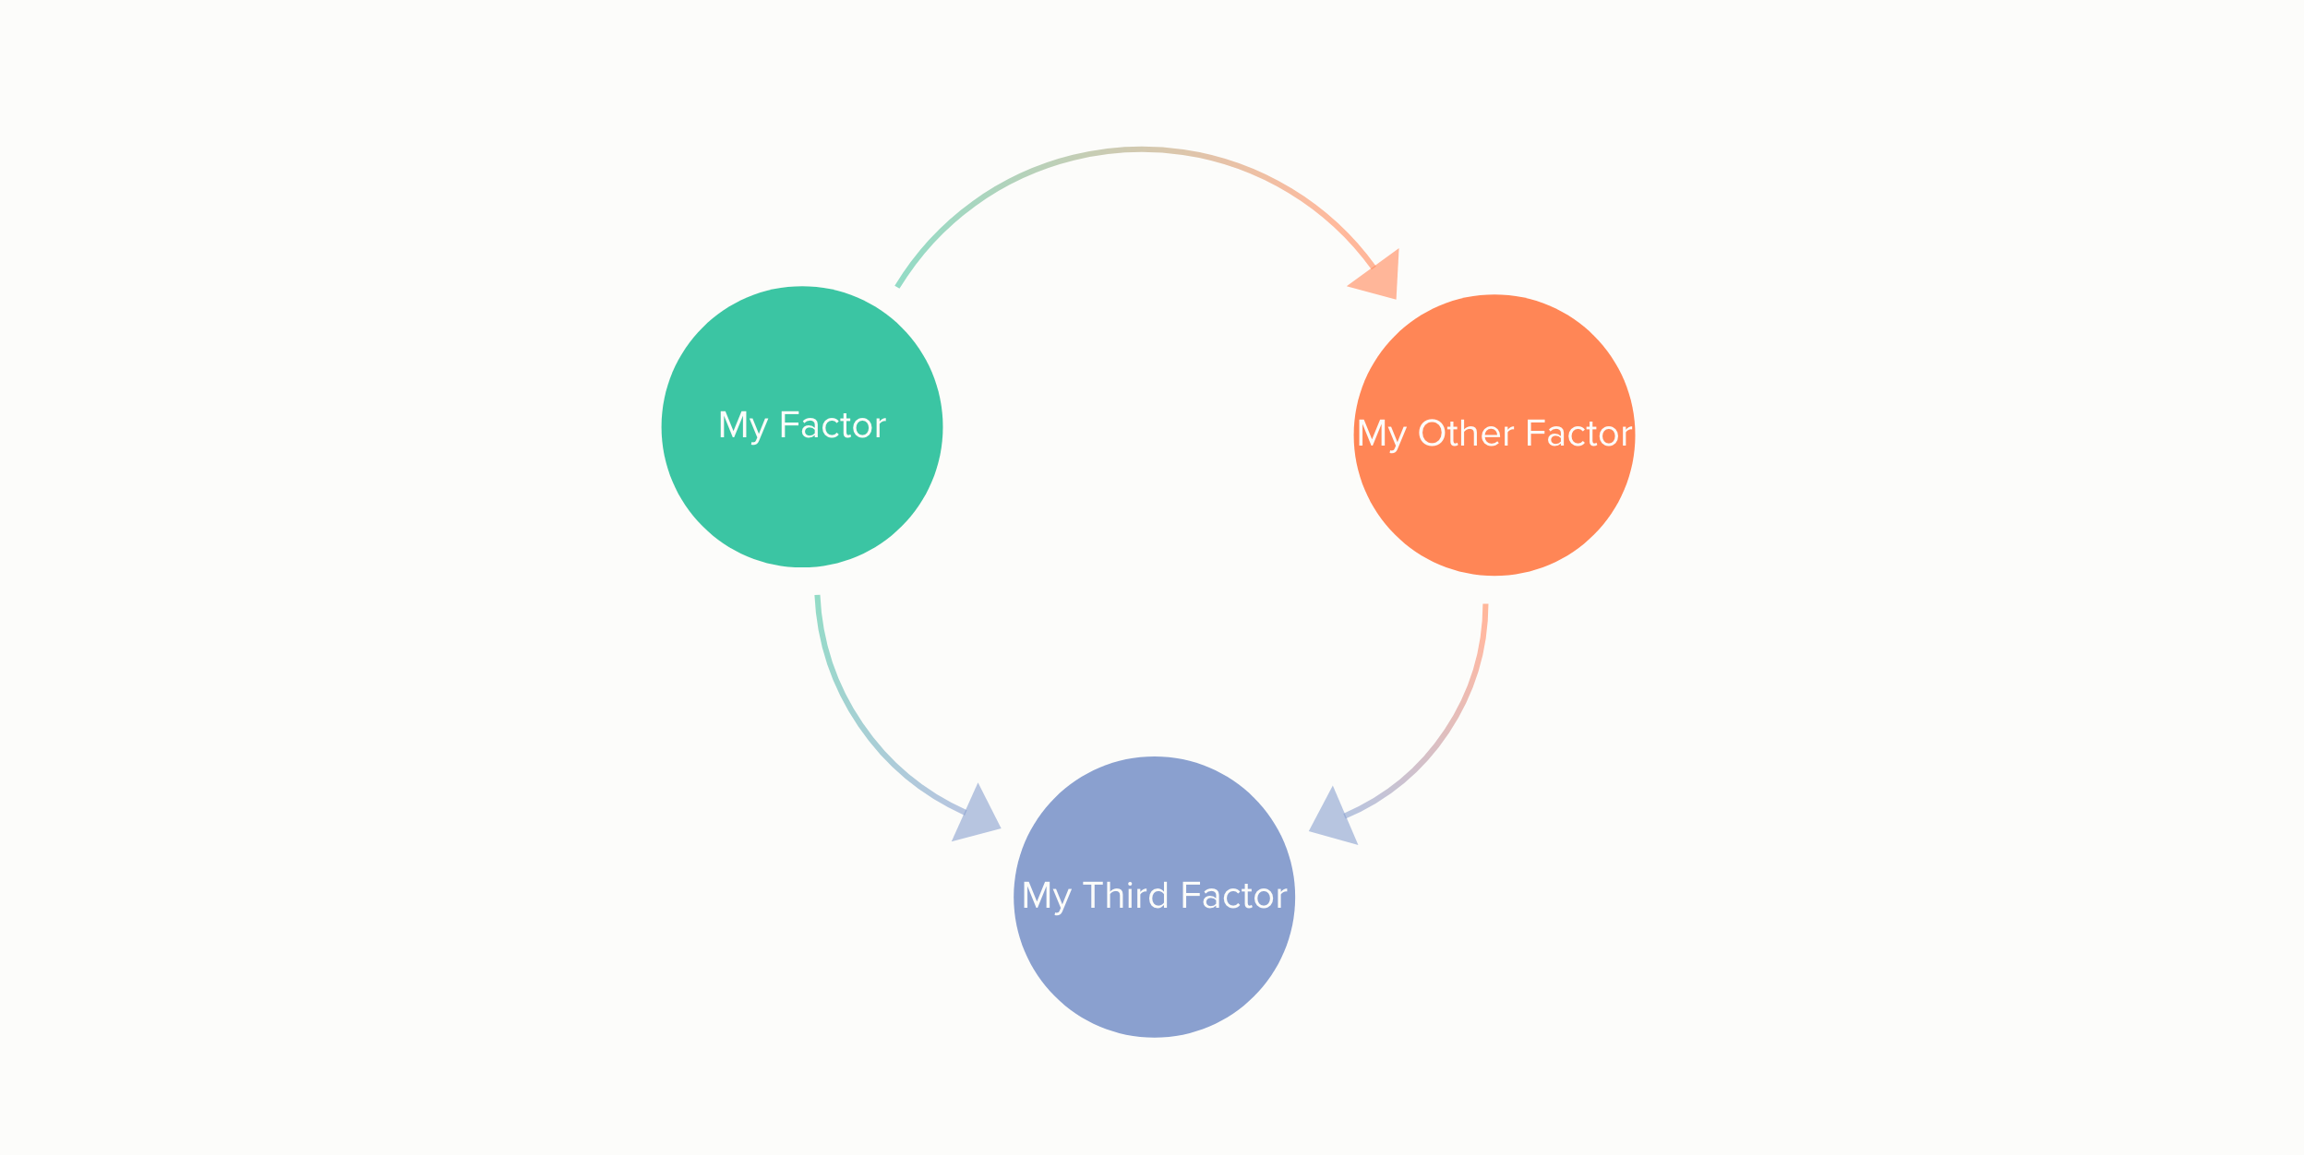
Here’s an example of a structure that looks like a loop, but is not, because no matter which arrow you follow, you always end up at the same factor, escaping the trap:

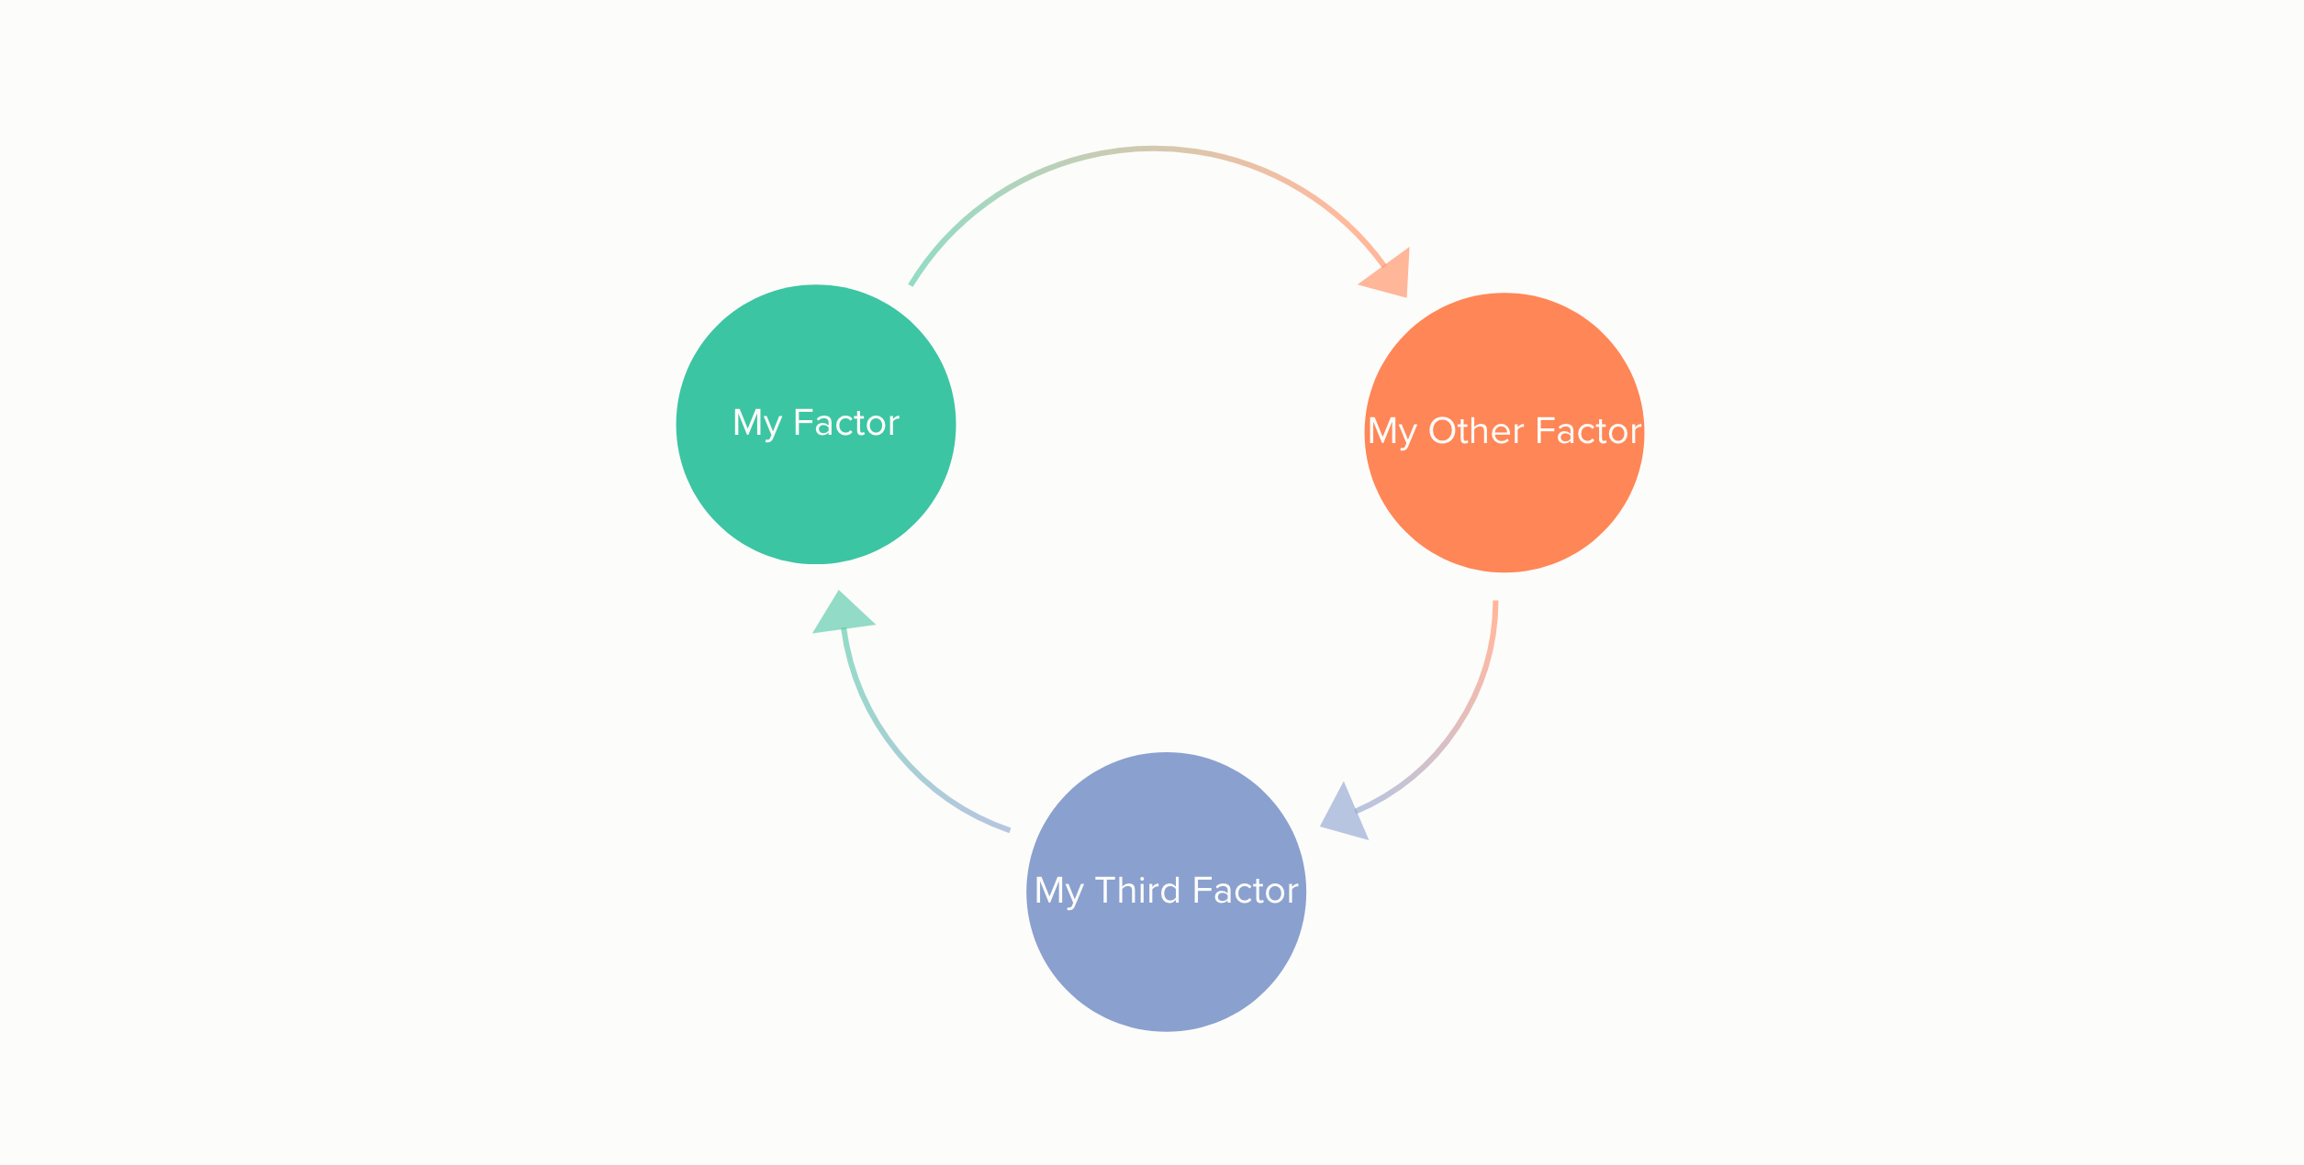
On the other hand, if you reverse just one of the arrows in the structure, you inevitably get trapped going around and around in a circle:

This is the kind of loop you’re looking for in a system map.
It’s rarely so simple—in many cases, your loops will contain more than three connections, and they likely won’t be laid out in such a nice, circular shape. You'll also have the rest of the elements and connections in the map contending for your attention. This is where loop detection comes in handy!
Loop detection
Automatic loop detection
We finally added the much-awaited feature that allows you to detect loops automatically!
To detect loops, follow these steps:
Create your map with some elements and connections, as you would normally.
Click on the green plus icon at the bottom of your map, and choose "Add loop".
Click "detect loops automatically".
A menu will pop up on the left side of your map with the detected loops.
Some things to know:
Loops are ranked from shortest (least amount of elements) to longest (most elements).
You can hover over any loop name to showcase it on the map and see which elements/connections are a part of it.
Click on any loop number to give it a name and save it. Unnamed loops are not saved in your dataset!
Adding a name to a loop will add that label to your map in the center of the loop.
Loops can only be exported with JSON. You can't export loops to Excel.
Automatic loop detection is not (yet) available for maps imported with Google Sheets. If you'd like to use loop detection, please import your map with Excel.
NOTE: Some maps are simply too large for Kumu to automatically detect loops, as the number of loops on a highly inter-connected system map can quickly run into the thousands. If you notice that loop detection is not giving you any results, you can try one of two things:
Try simplifying your map by deleting unnecessary elements and/or connections.
Filter out one part of your map and run loop detection again. Make sure to save your loops before you filter another part of the map!
Decorating loops
Once you've identified your loops, you might want to customize how they look! One common thing to change is your loops' font size. This can be done in the Advanced Editor, like so:
This code will change the font size for all loops. If you just want to change the size for a specific loop, you can use a selector. Here's an example that selects by label to decorate one loop:
Less common, but still useful, is to categorize loops with types like Vicious, Virtuous, Stagnating, and Stabilizing, then color-code by those loop types. If you add those types to the Loop Type field (under the Label in the profile), you can use this code to color code automatically:
You can replace olympic with the name of any of our color palettes.
Last updated
Was this helpful?